Welcome aboard the Data Express, your journey around the bustling network of the MTA’s Open Data platform to guide you through the peaks and valleys of subway ridership! If you’ve ever found yourself caught in a rush-hour tide or squeezed into a crowded subway car, you know the value of timing your travel. Today’s blog post is your ticket to navigate our platform’s integrated tools and leverage the power of the Socrata API and Socrata Query Language (SoQL) on one of MTA’s most dynamic datasets: Subway Hourly Ridership. Imagine planning your journey to a timely arrival at New Year's celebrations, all by analyzing subway data to avoid peak ridership times and enjoy the valleys.
Let’s start by locating the Subway Hourly Ridership open dataset. You can either search the dataset on data.ny.gov or go directly to the dataset. The page should look like Figure 1.
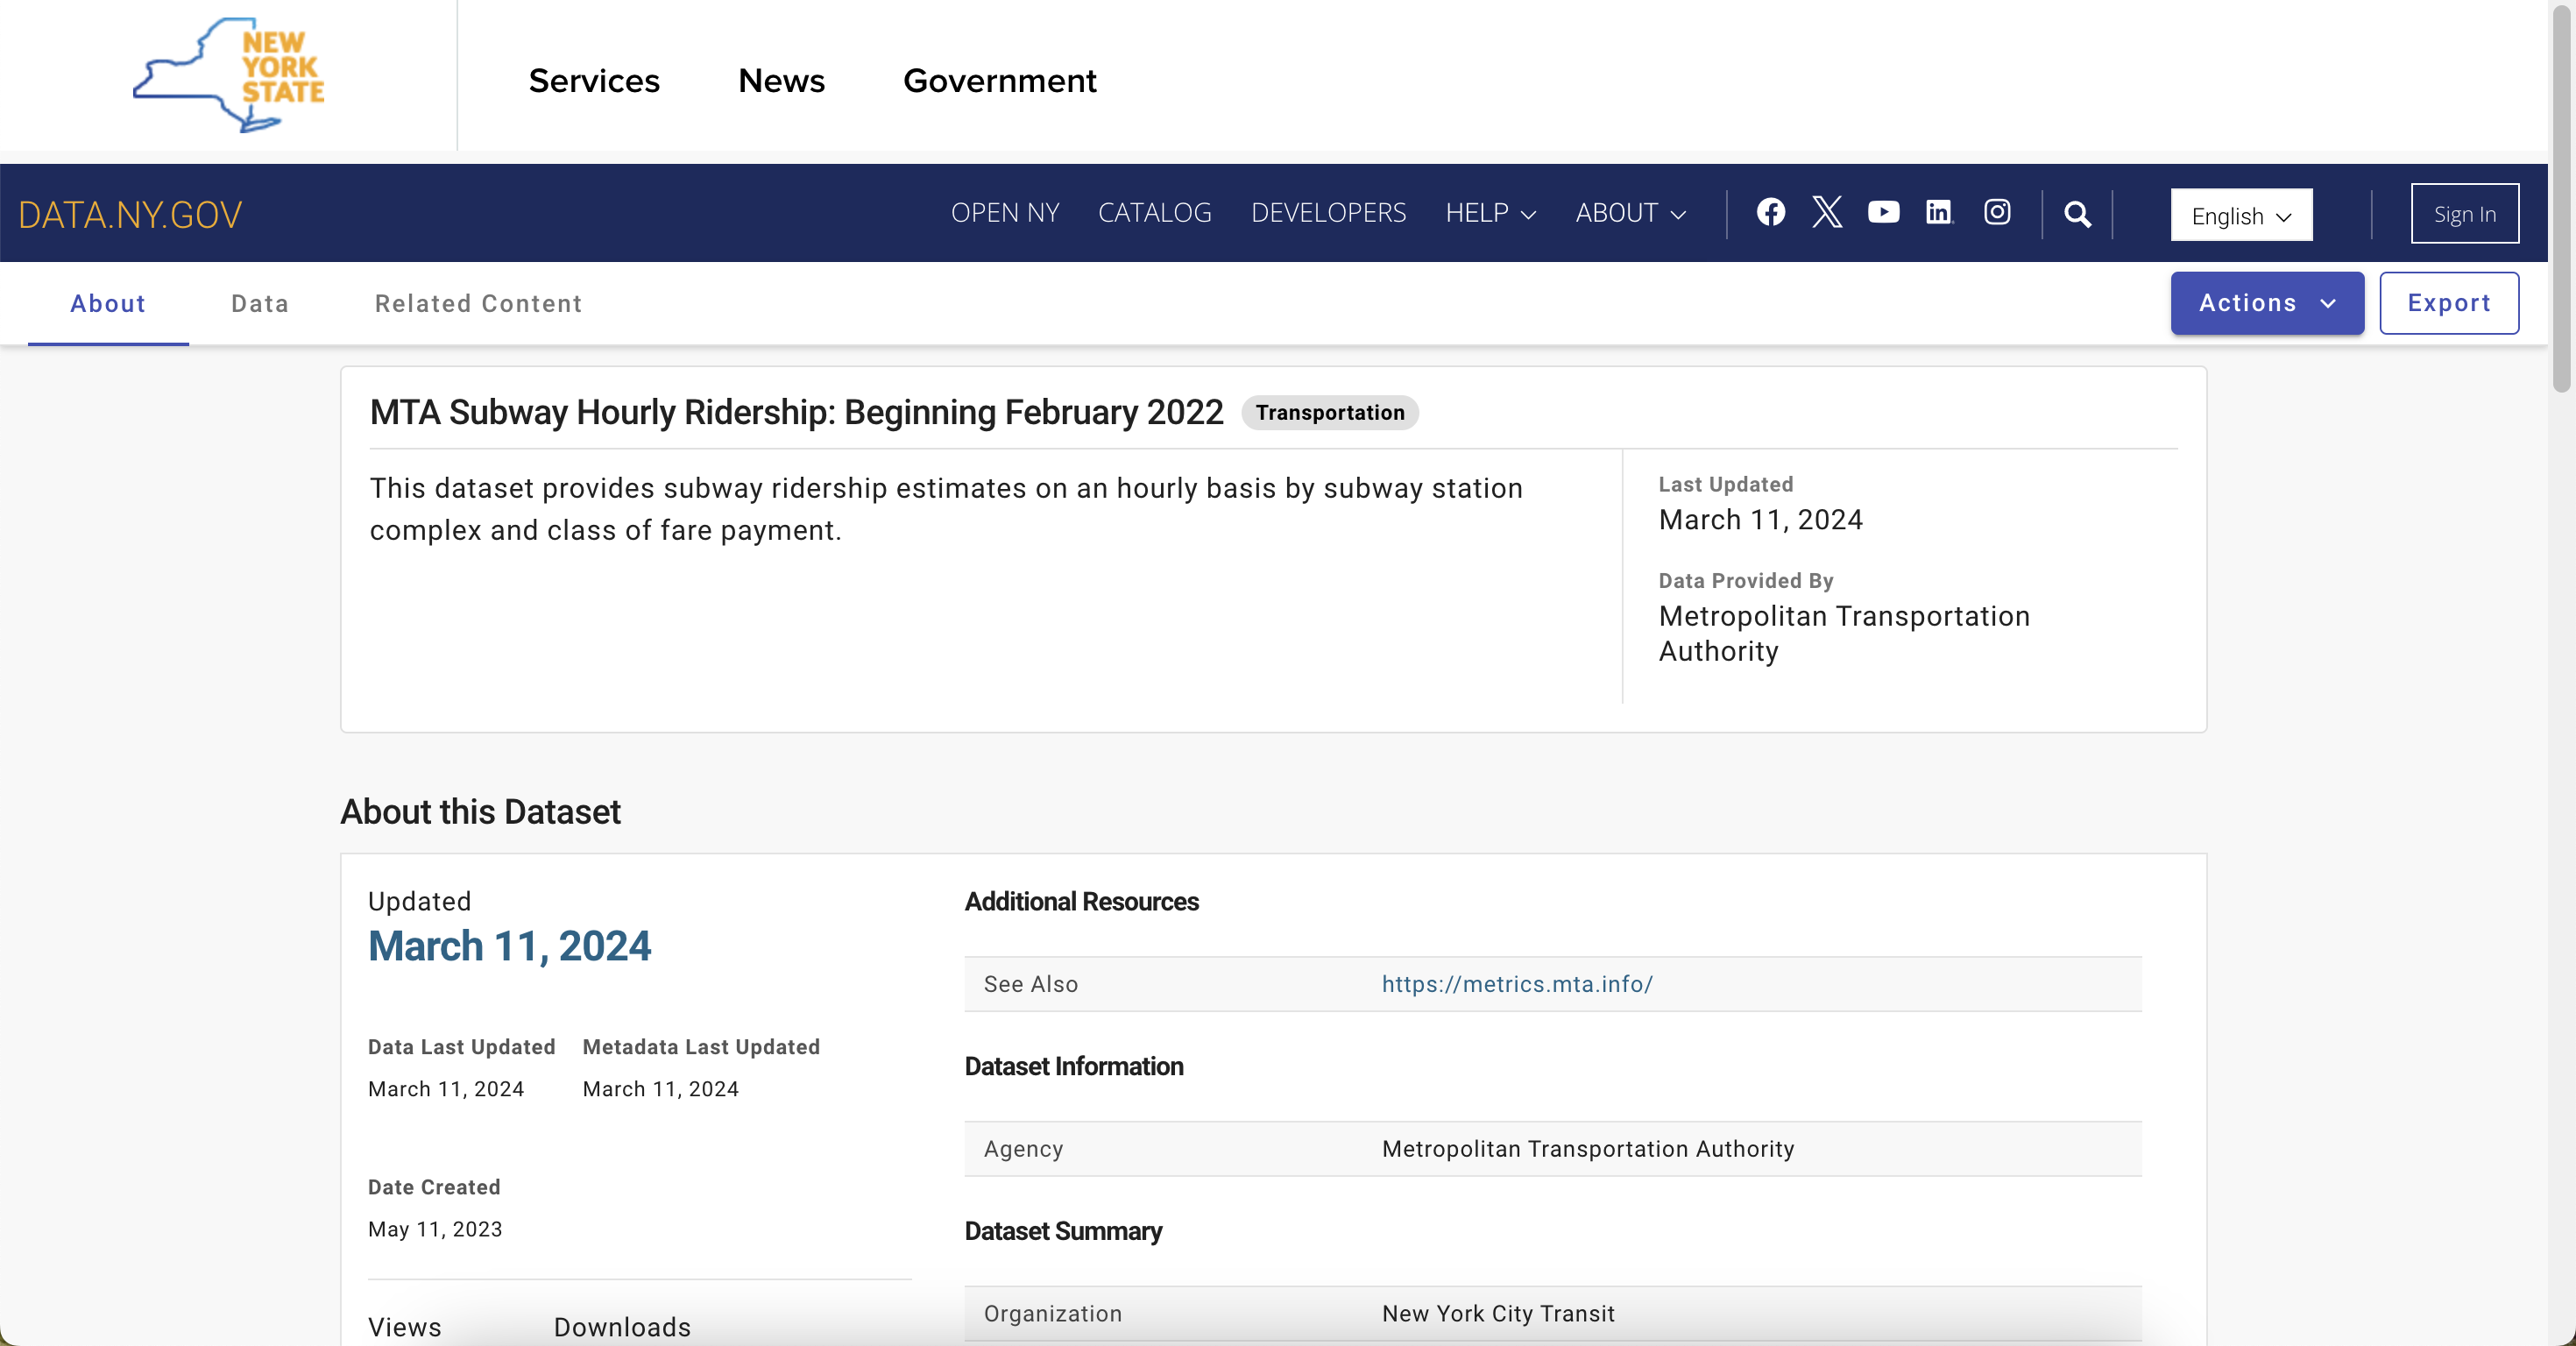
In our trip to navigate the MTA’s vast datasets, it's helpful to approach the data with specific questions in mind. In this post, we’ll analyze the Subway Hourly Ridership dataset to determine how to avoid the Times Square crowds on New Year’s Eve. We’ll go through different methods for accessing the data and applying queries in order to make such a large dataset more manageable.
Accessing the data: Option 1: Data lens
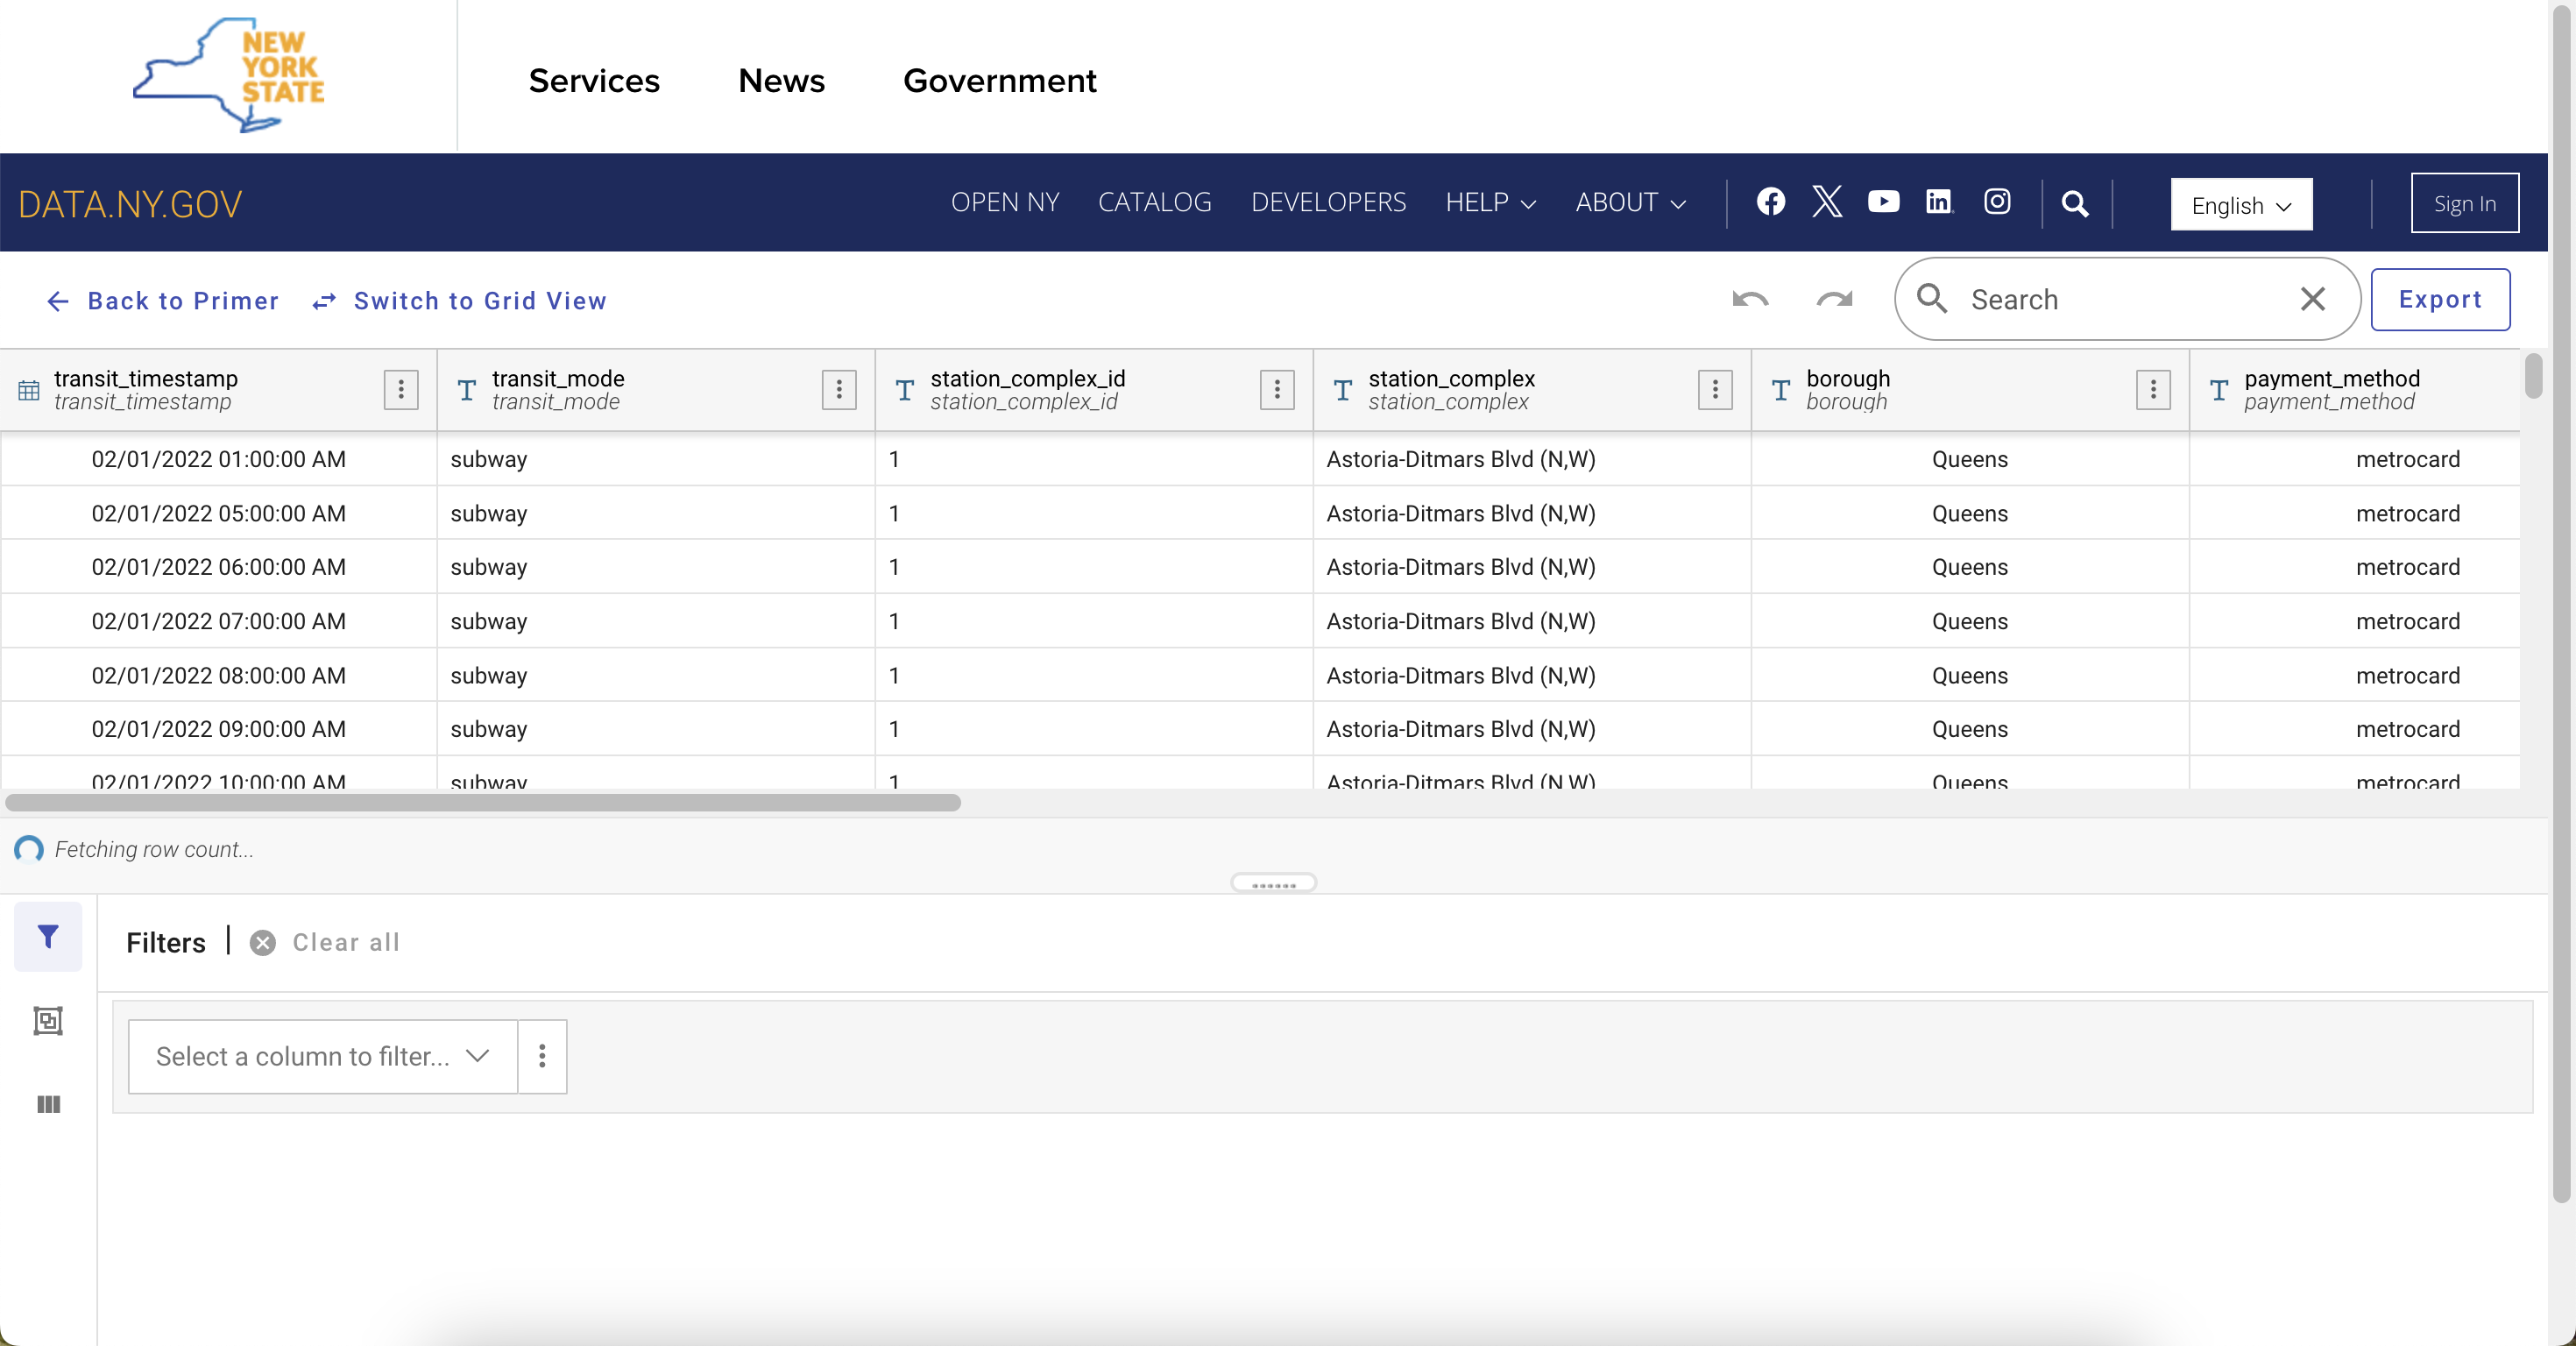
For the data lens view, locate the ‘Data’ button on the upper left corner of the page. This leads you to a new page where you can quickly query the data.
Accessing the data: Option 2: Dataset interface query
Another option is to use an integrated, user-friendly tool to query the data from our Socrata server by selecting the ‘Actions’ button on the right of the home page, followed by ‘Query data.’
Refining the dataset through filters
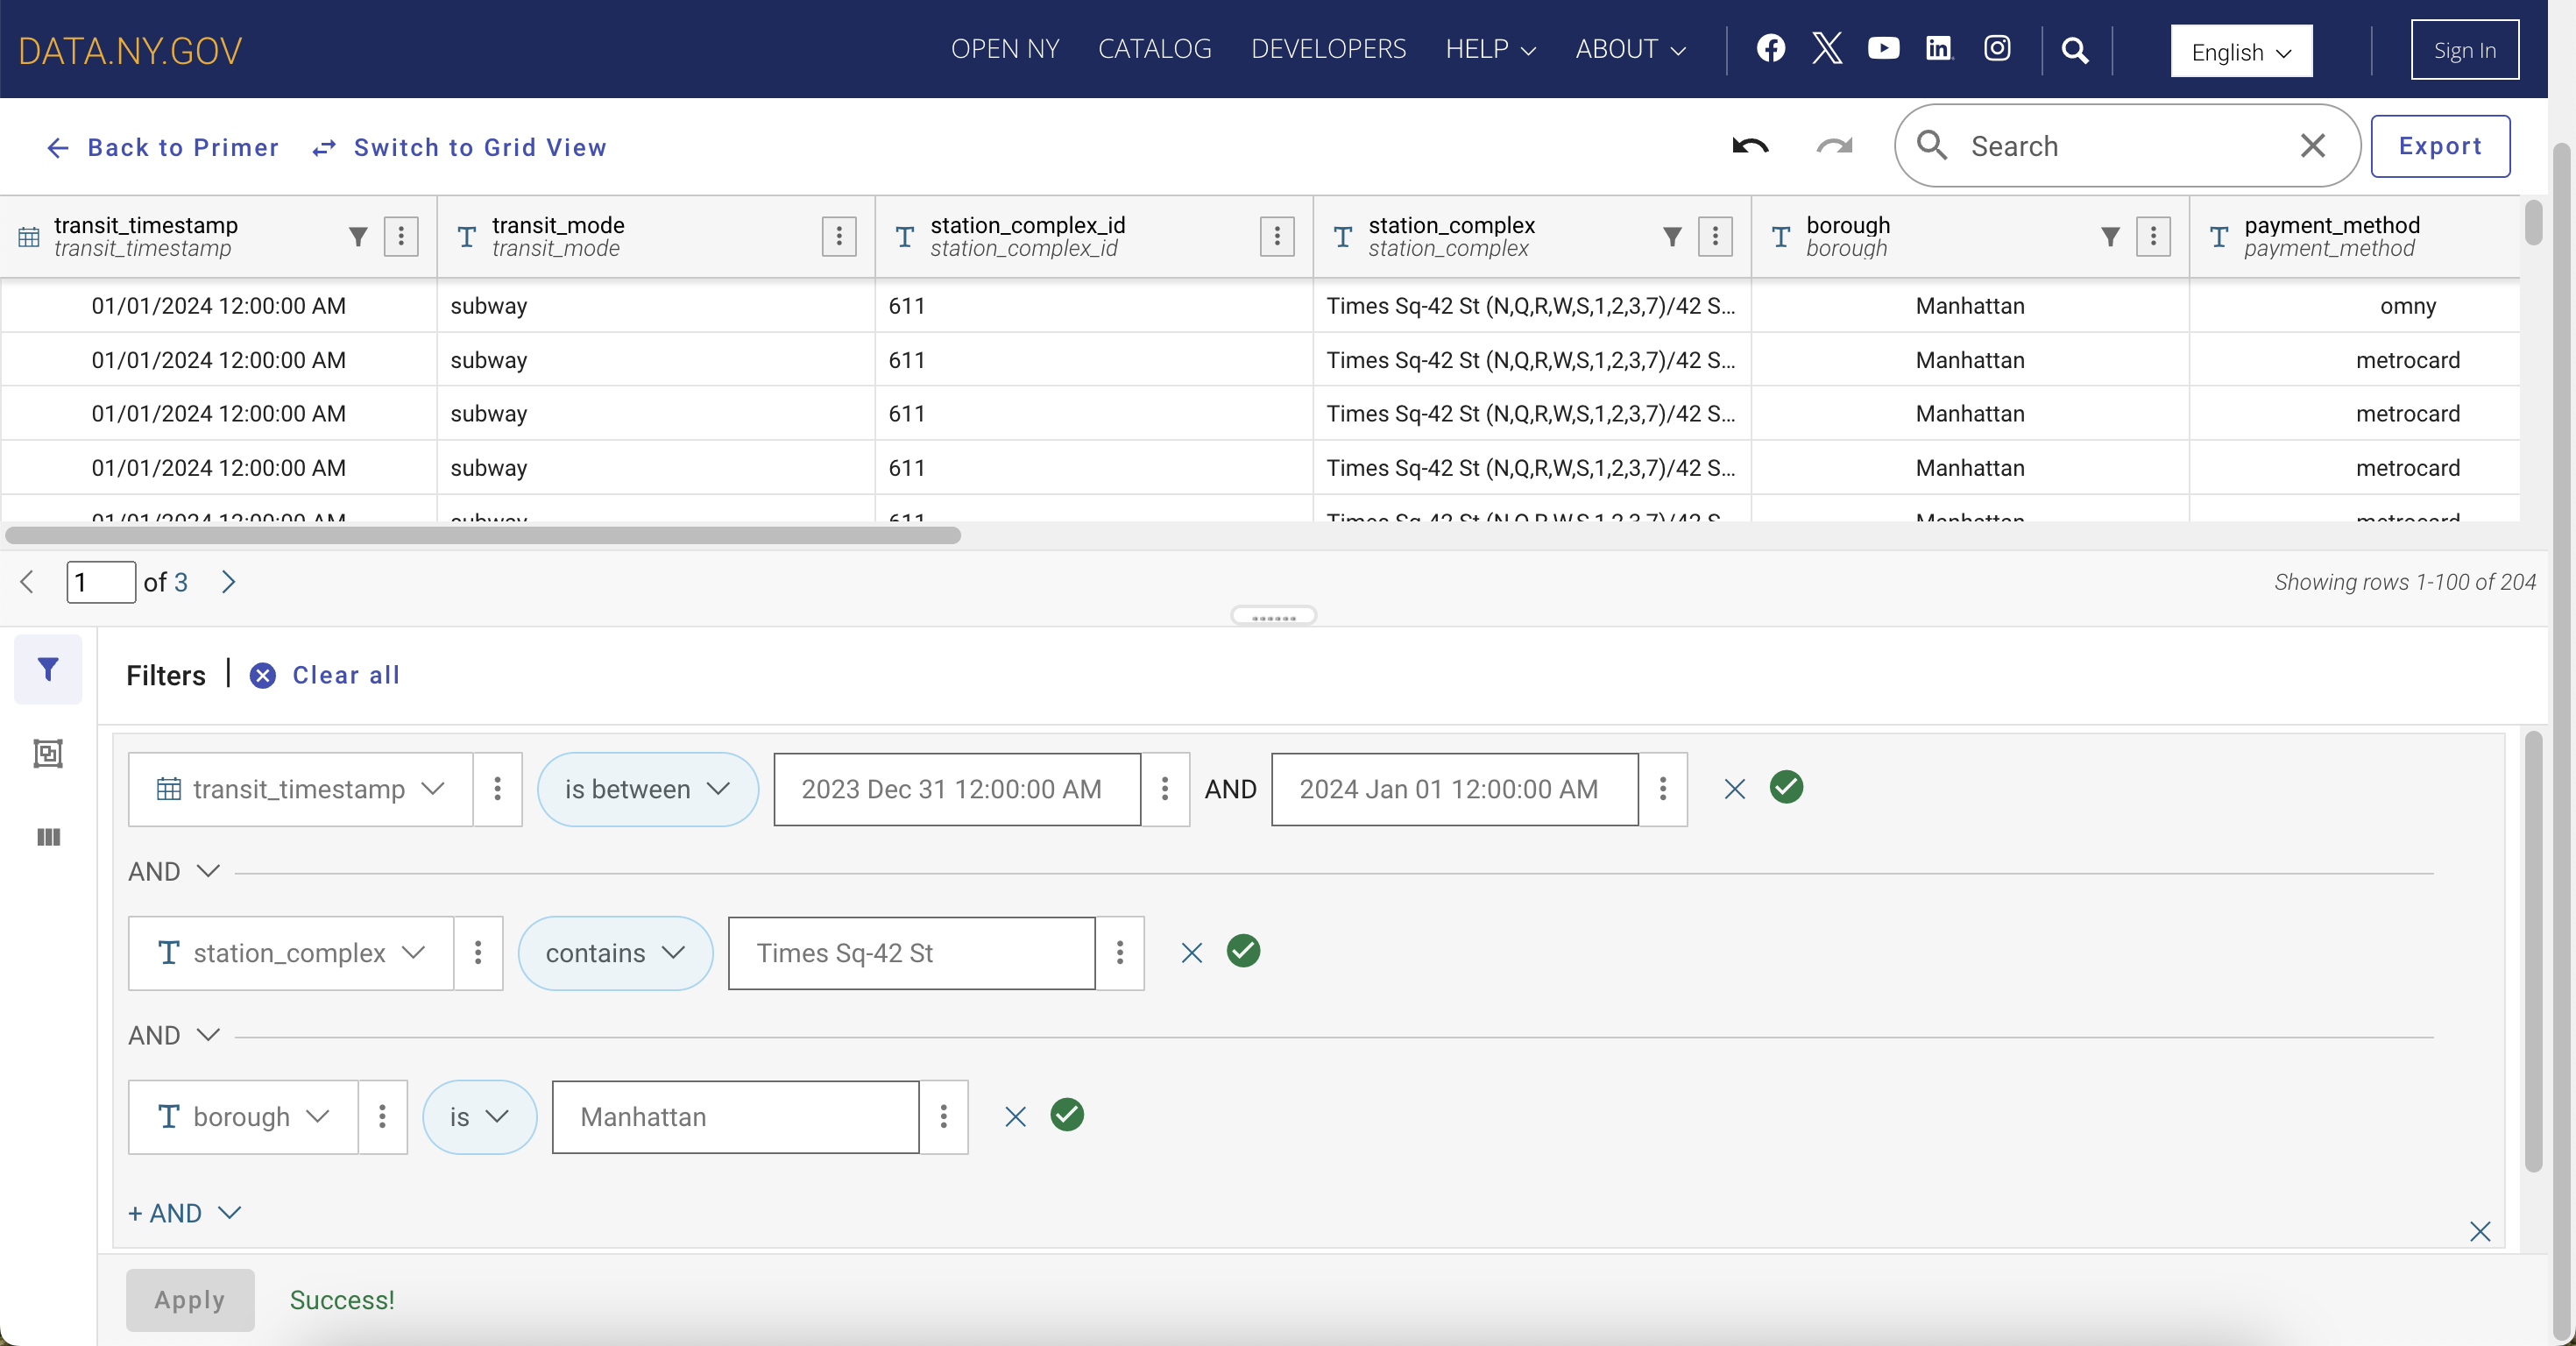
Given the large volume of data, filters are a crucial step in managing the dataset.
Figure 3 shows filters applied to narrow down the dataset by:
- transit_timestamp: A range is set between December 31, 2023 12:00 a.m. and January 1, 2024 12:00 a.m. to focus exclusively on New Year’s Eve data.
- station_complex: A filter is applied for “Times Sq-42 St” to obtain data from this particular station complex.
- borough: This second location filter set to “Manhattan” is helpful in the event we want to modify our query scope for further analysis, such as nearby stations.
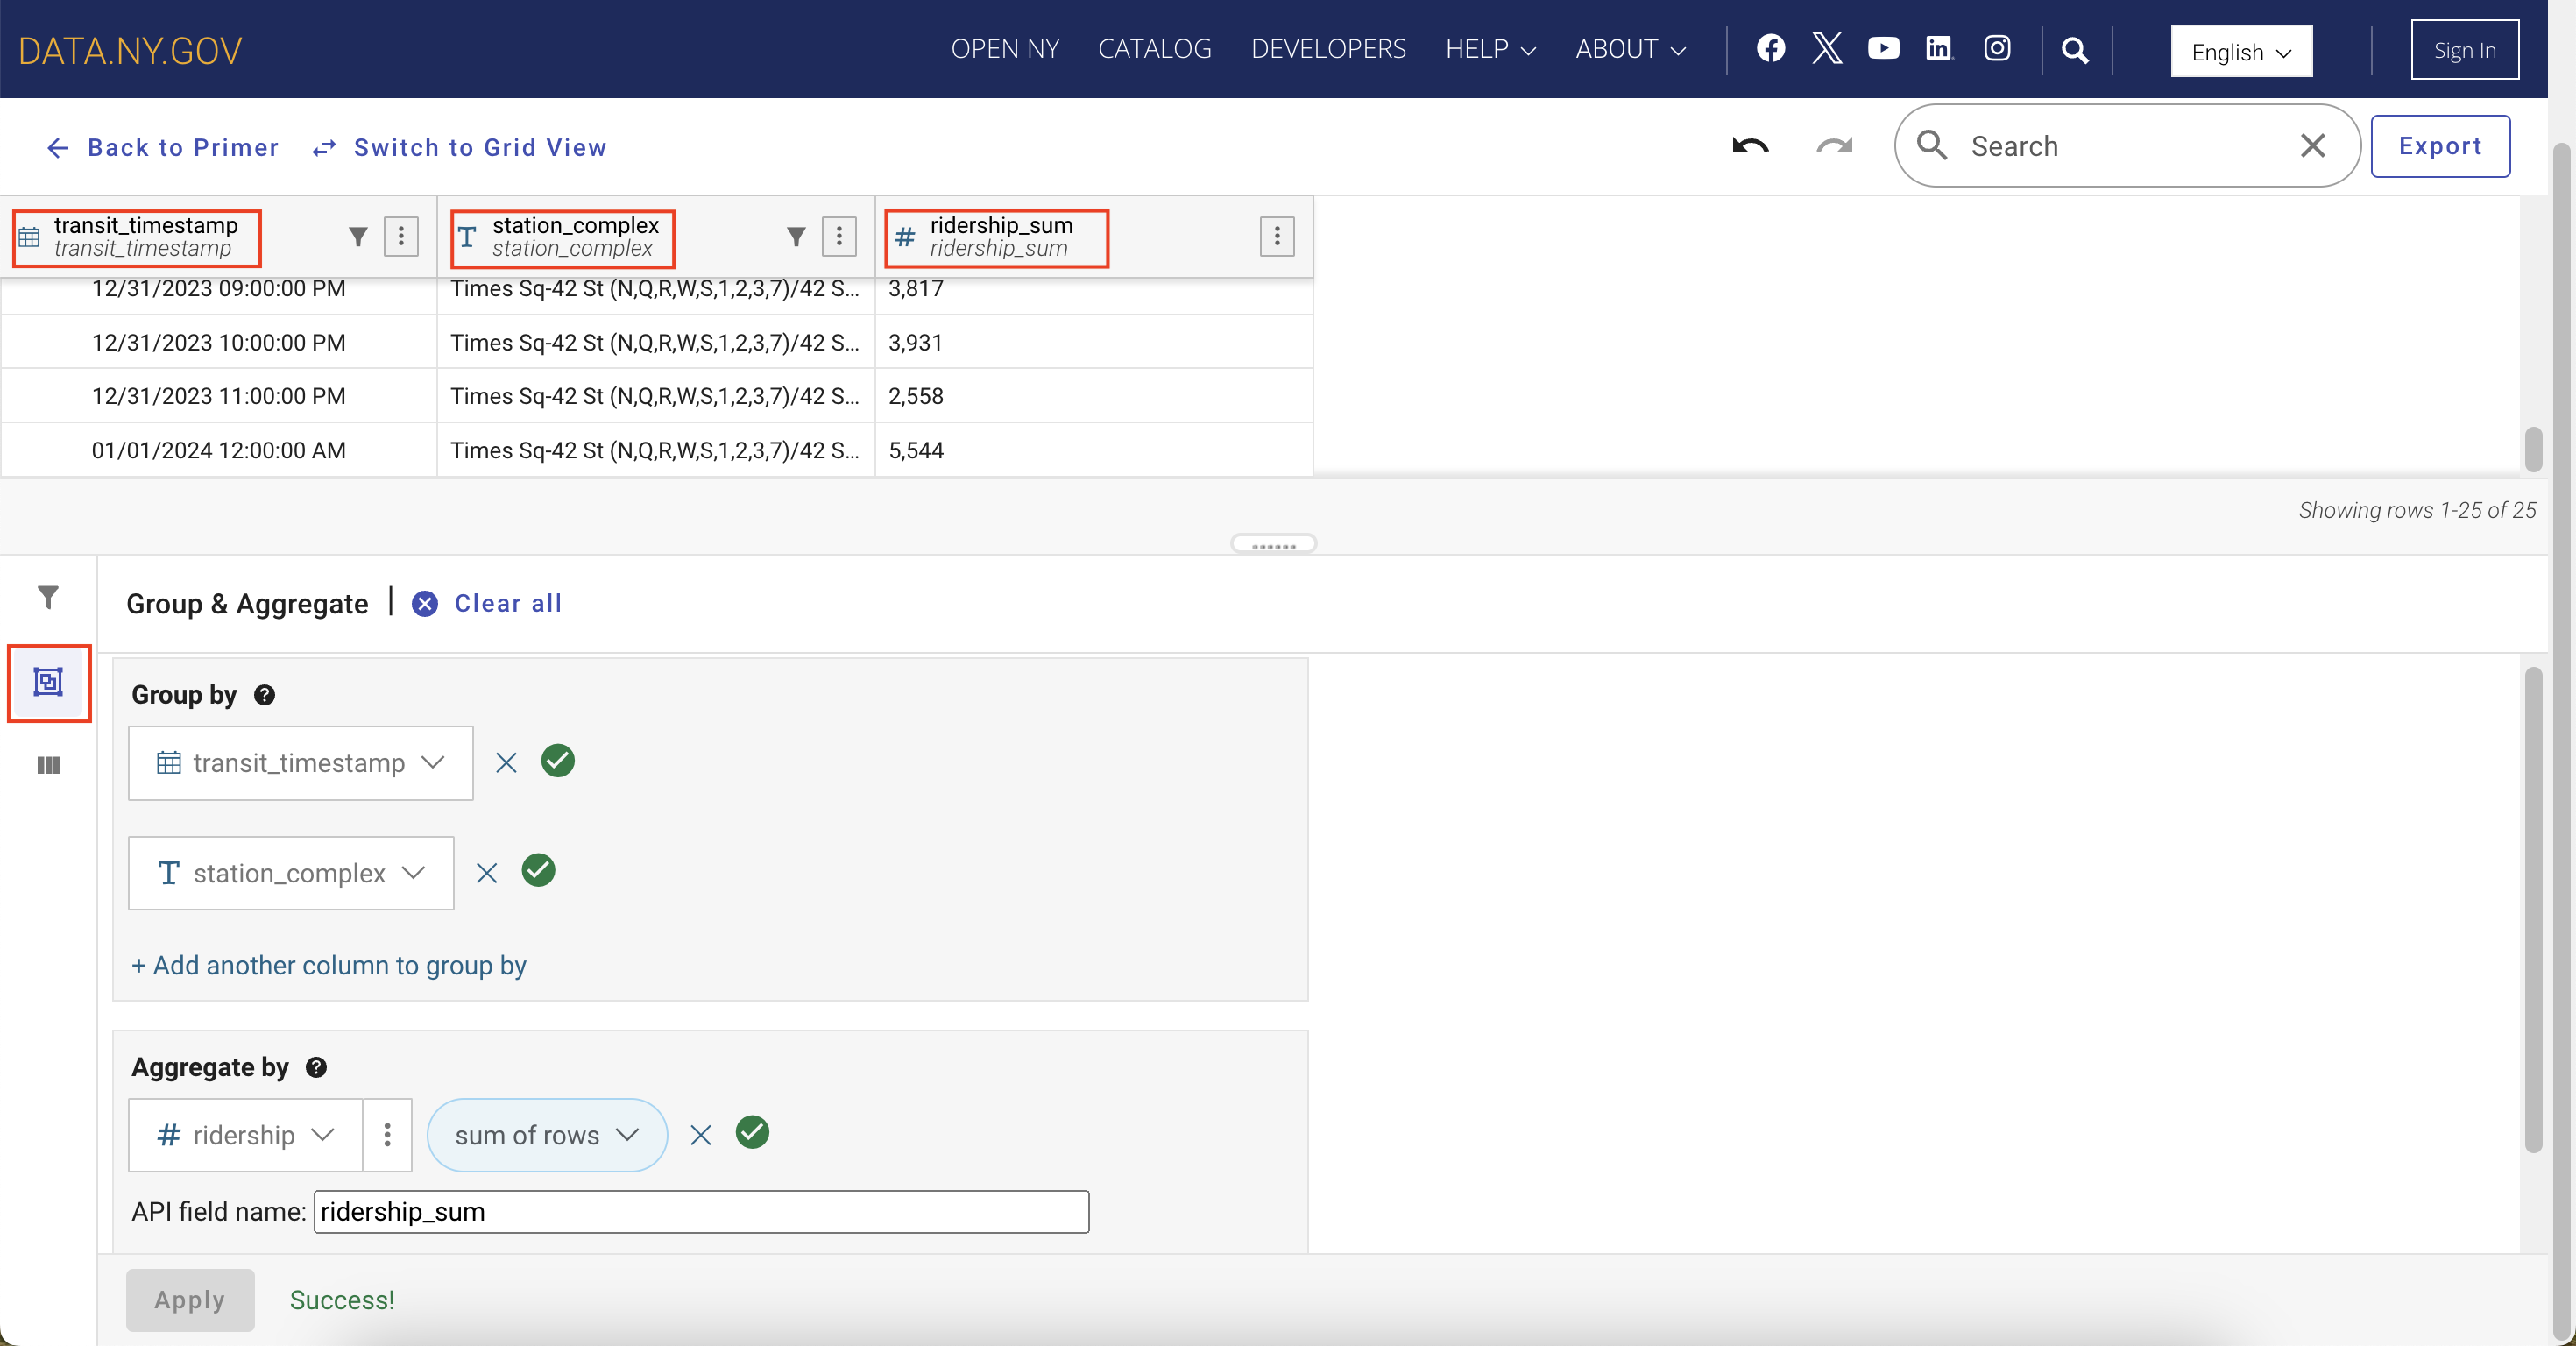
Grouping and aggregating data
- In this step, data grouping is performed to organize the dataset by transit_timestamp and station_complex.
- Aggregation is then applied to sum the ridership field, which provides the total amount of riders per timestamp and station, to display ridership volume trends over time.
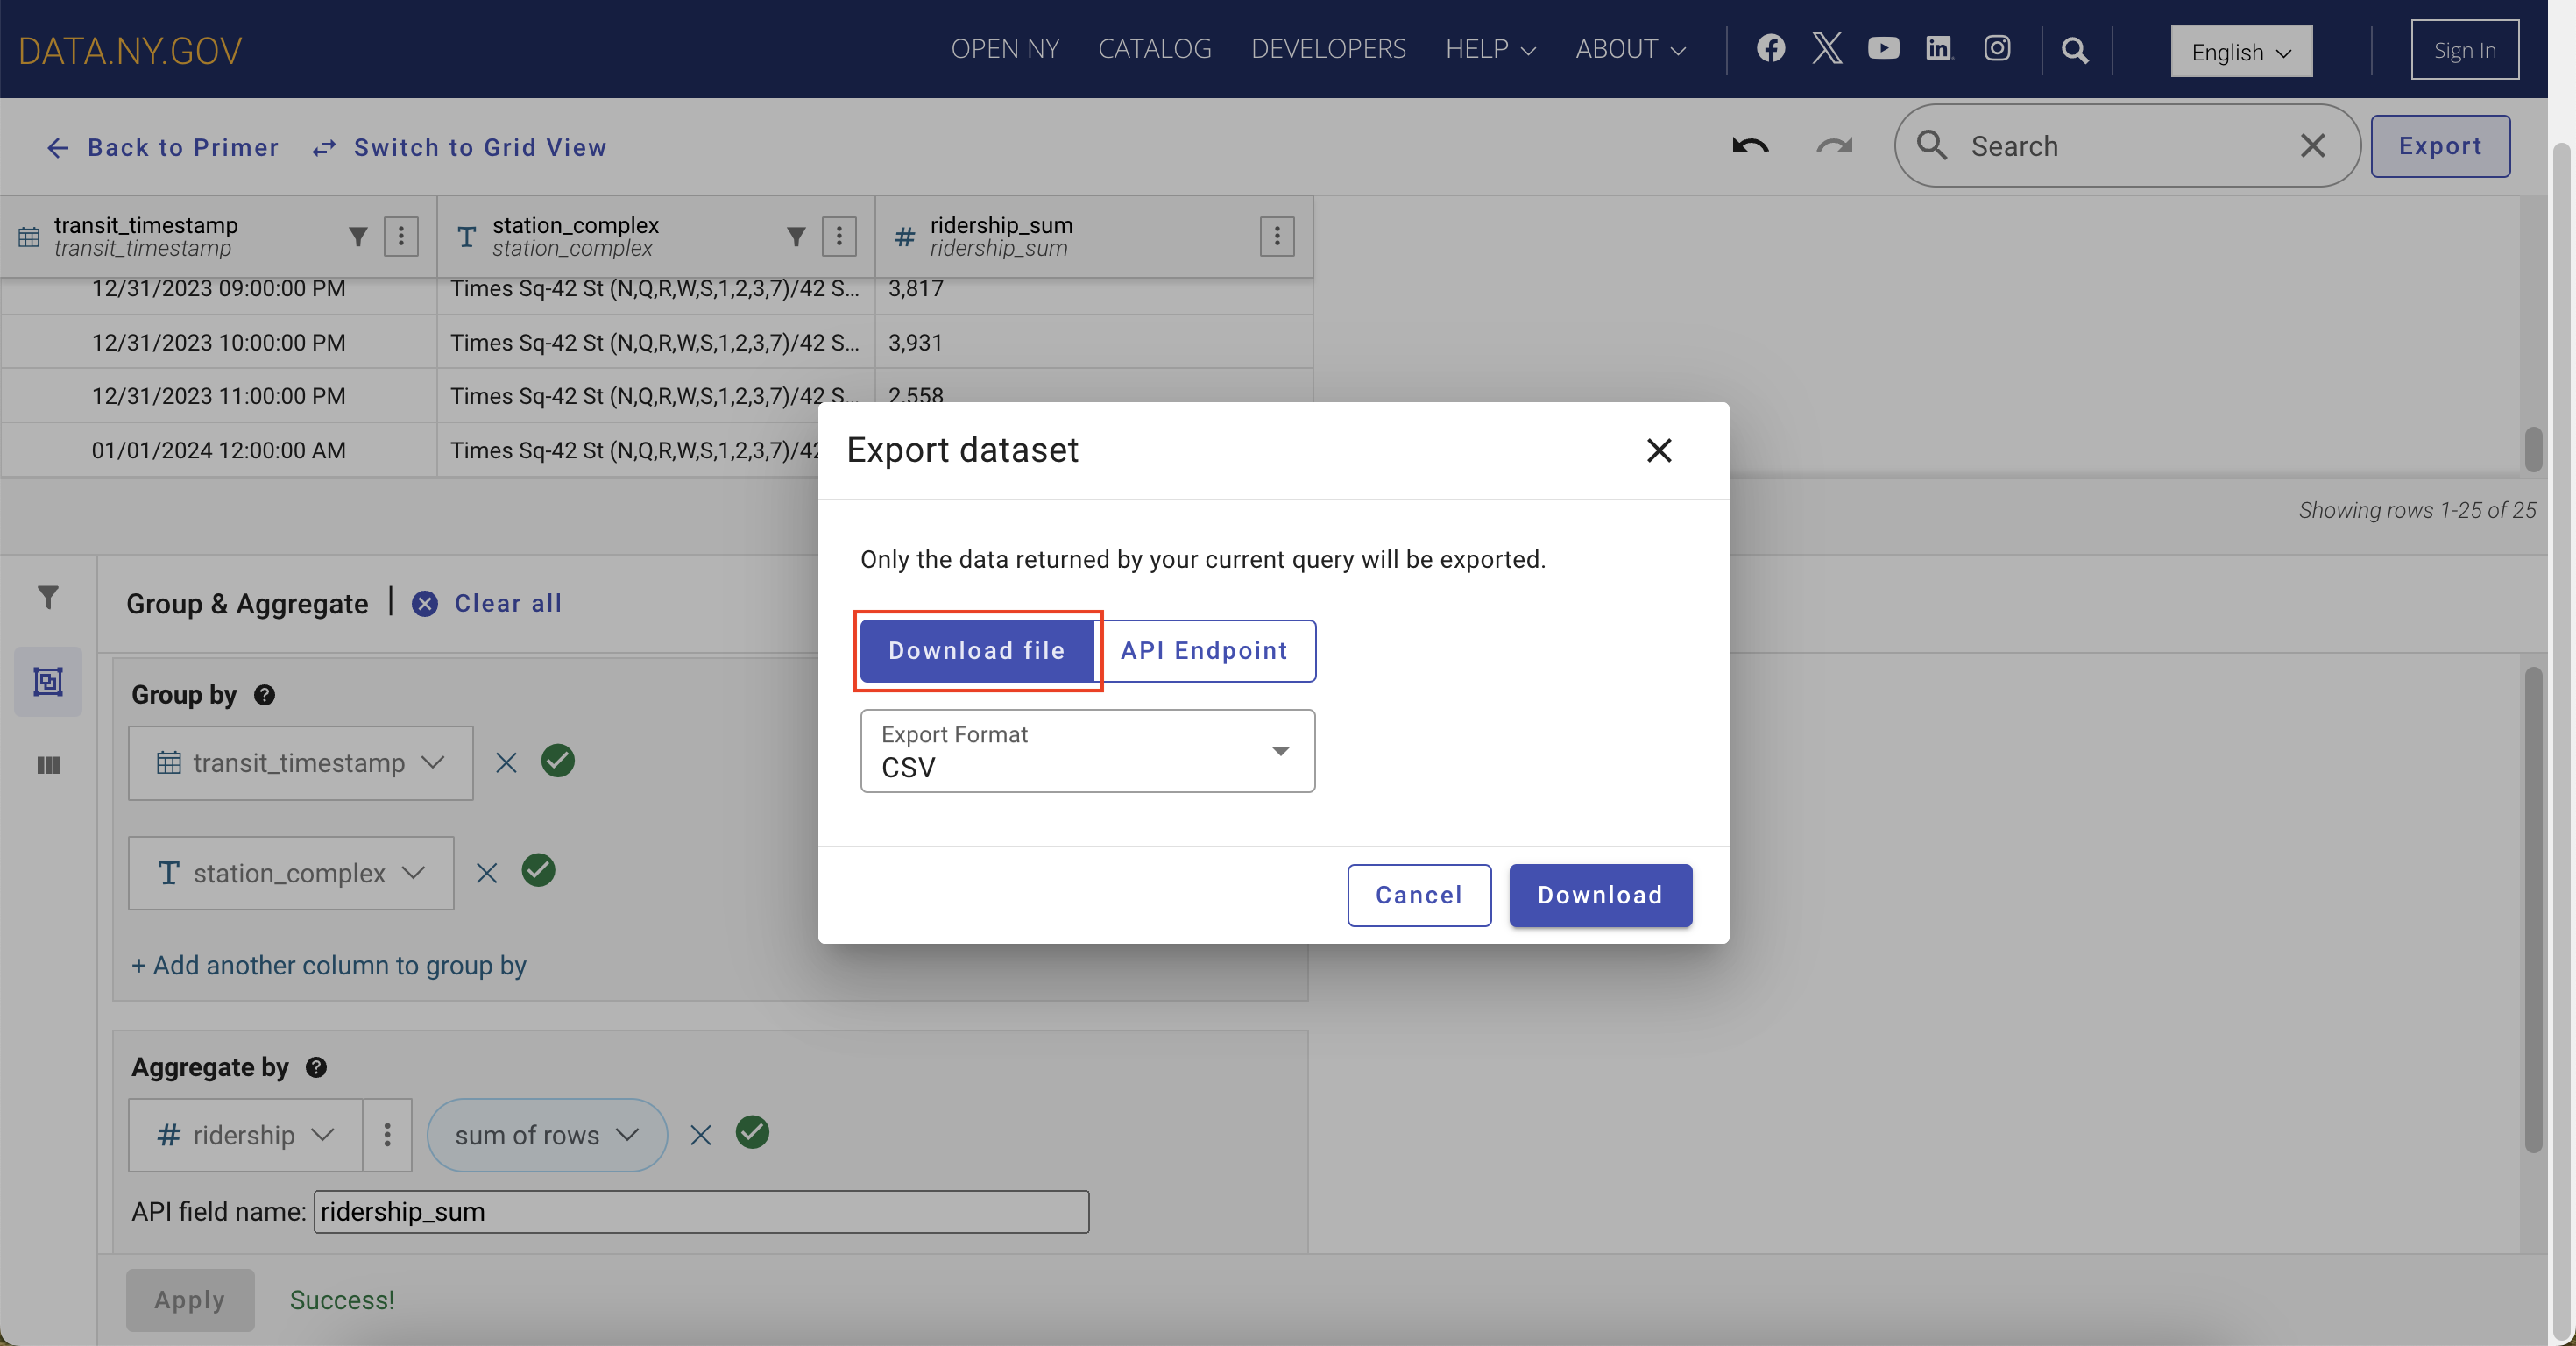
Exporting the dataset: Option 1: Download file
The Export dialog box allows you to download a file of the refined dataset. You will then be prompted to choose the format for the export; in this instance, select the CSV option.
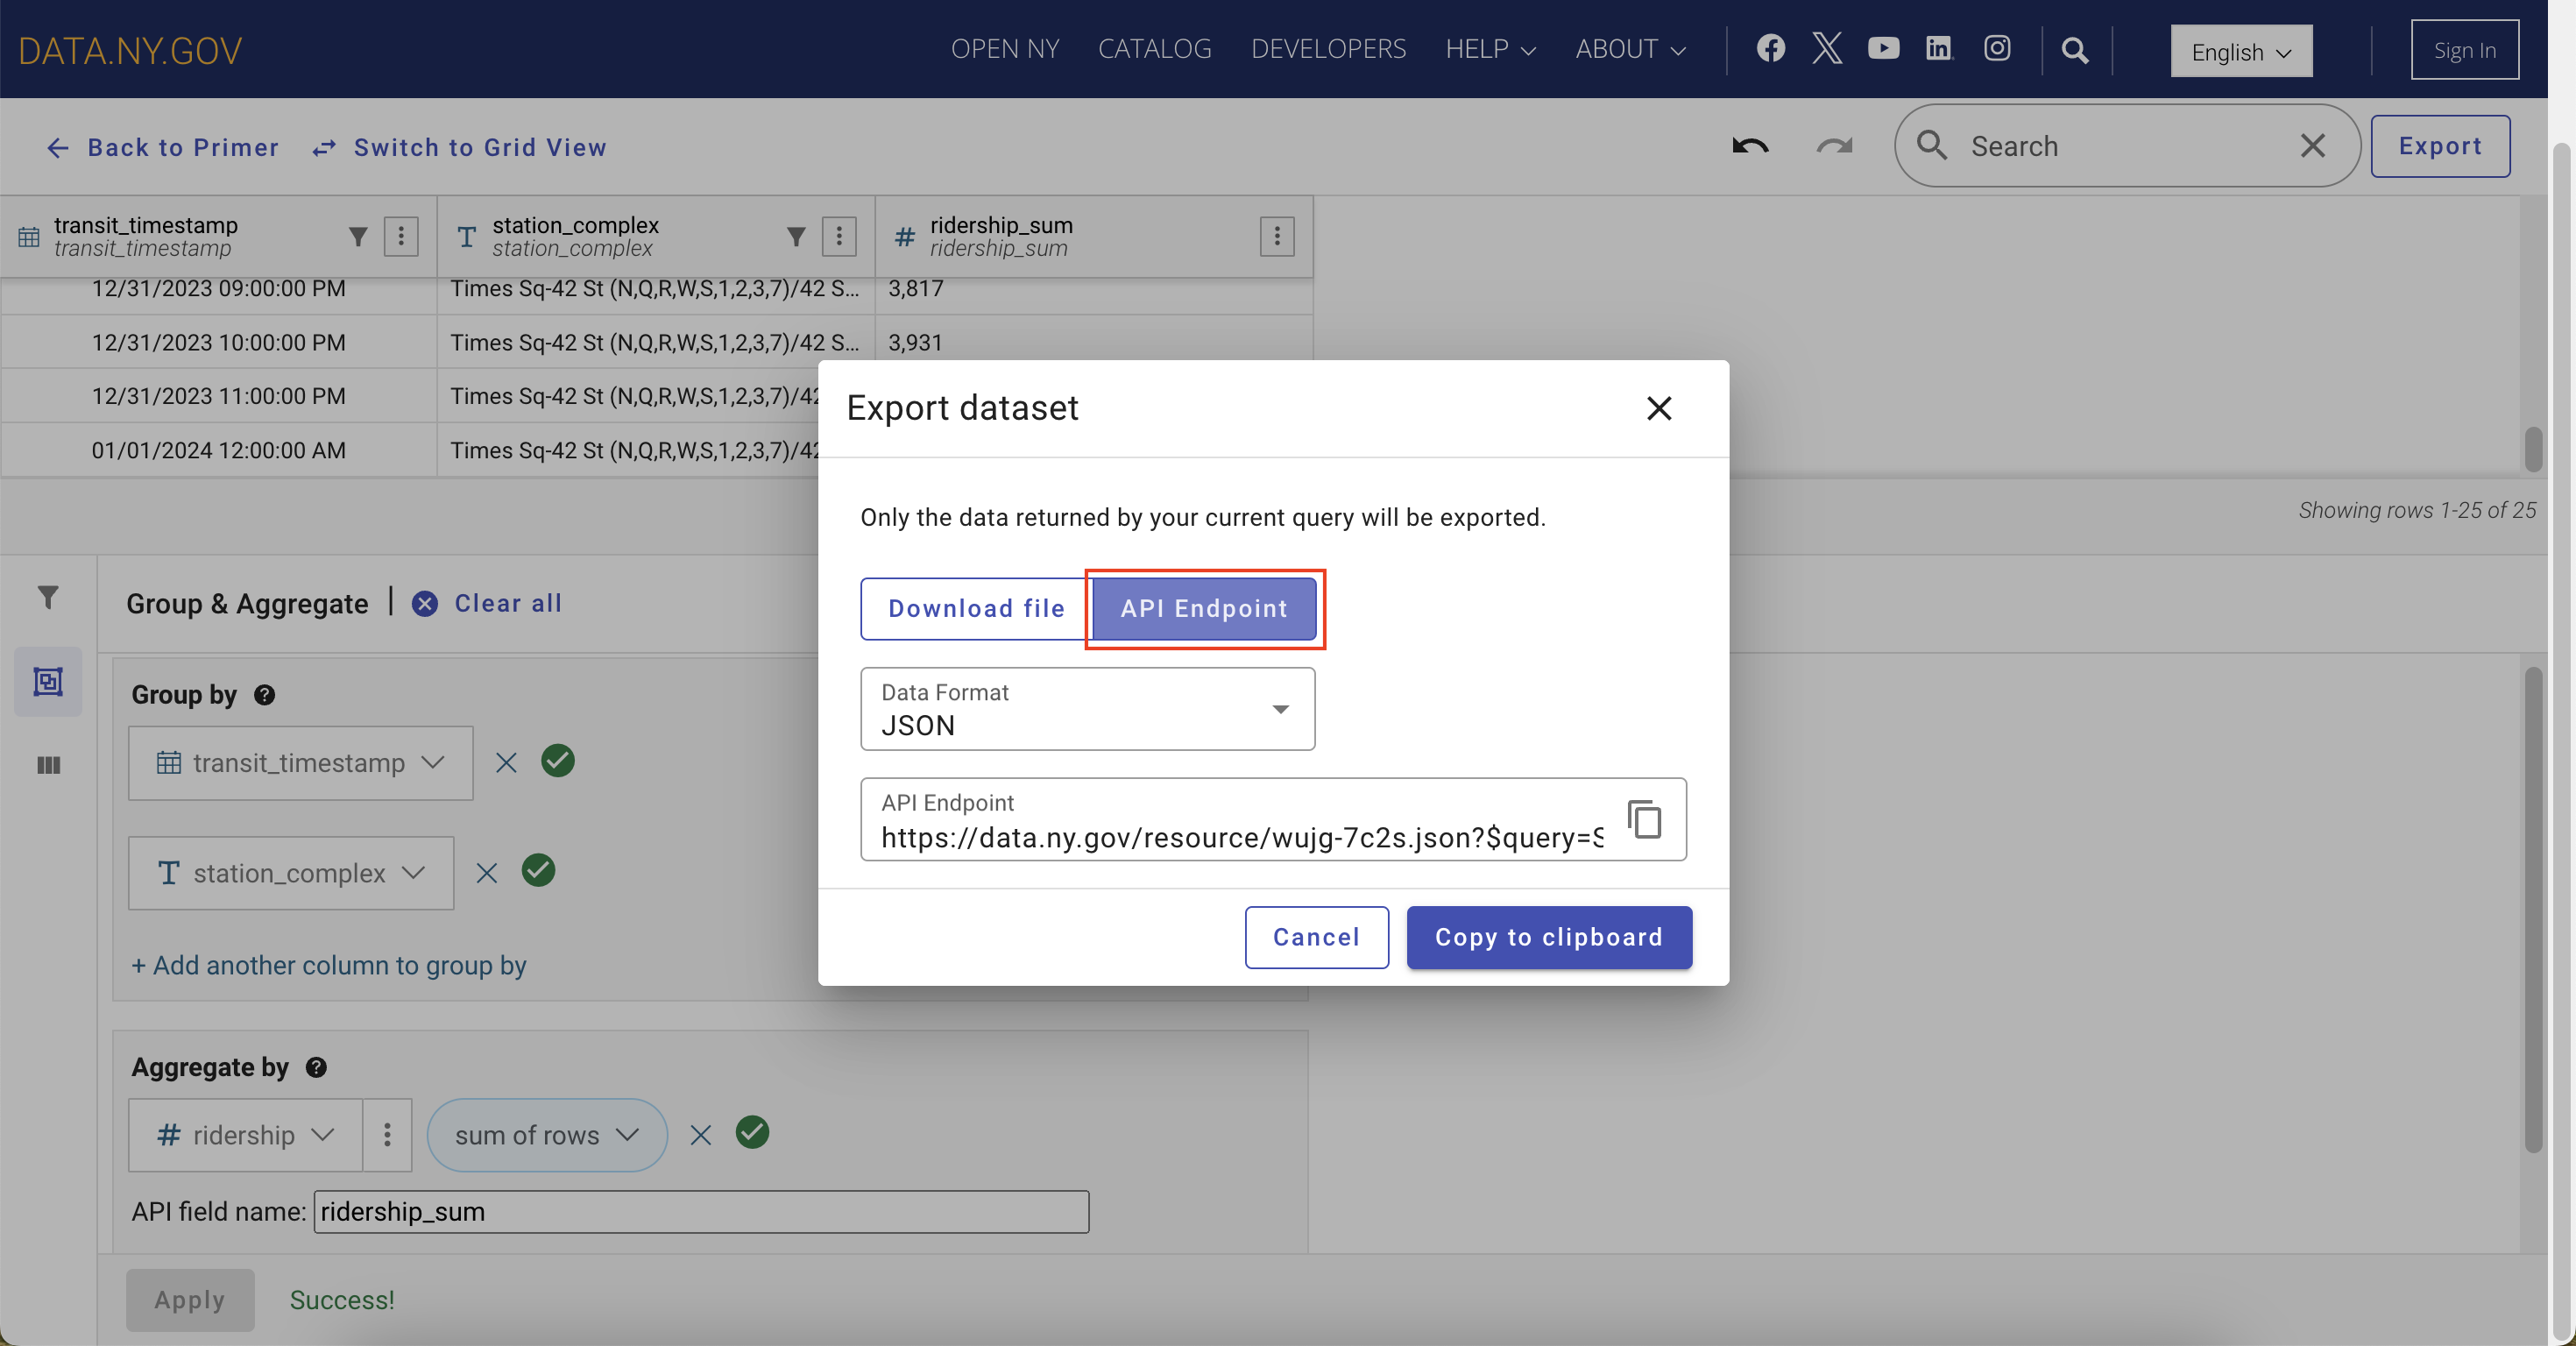
Exporting the dataset: Option 2: API endpoint
Alternatively, you can obtain an API endpoint for the filtered dataset. The dialog box presents JSON as the default format and the respective API endpoint URL. Similar to the file export option, there are multiple data formats to choose from. This URL is used to access the filtered dataset, allowing for query automation or integration with other applications.
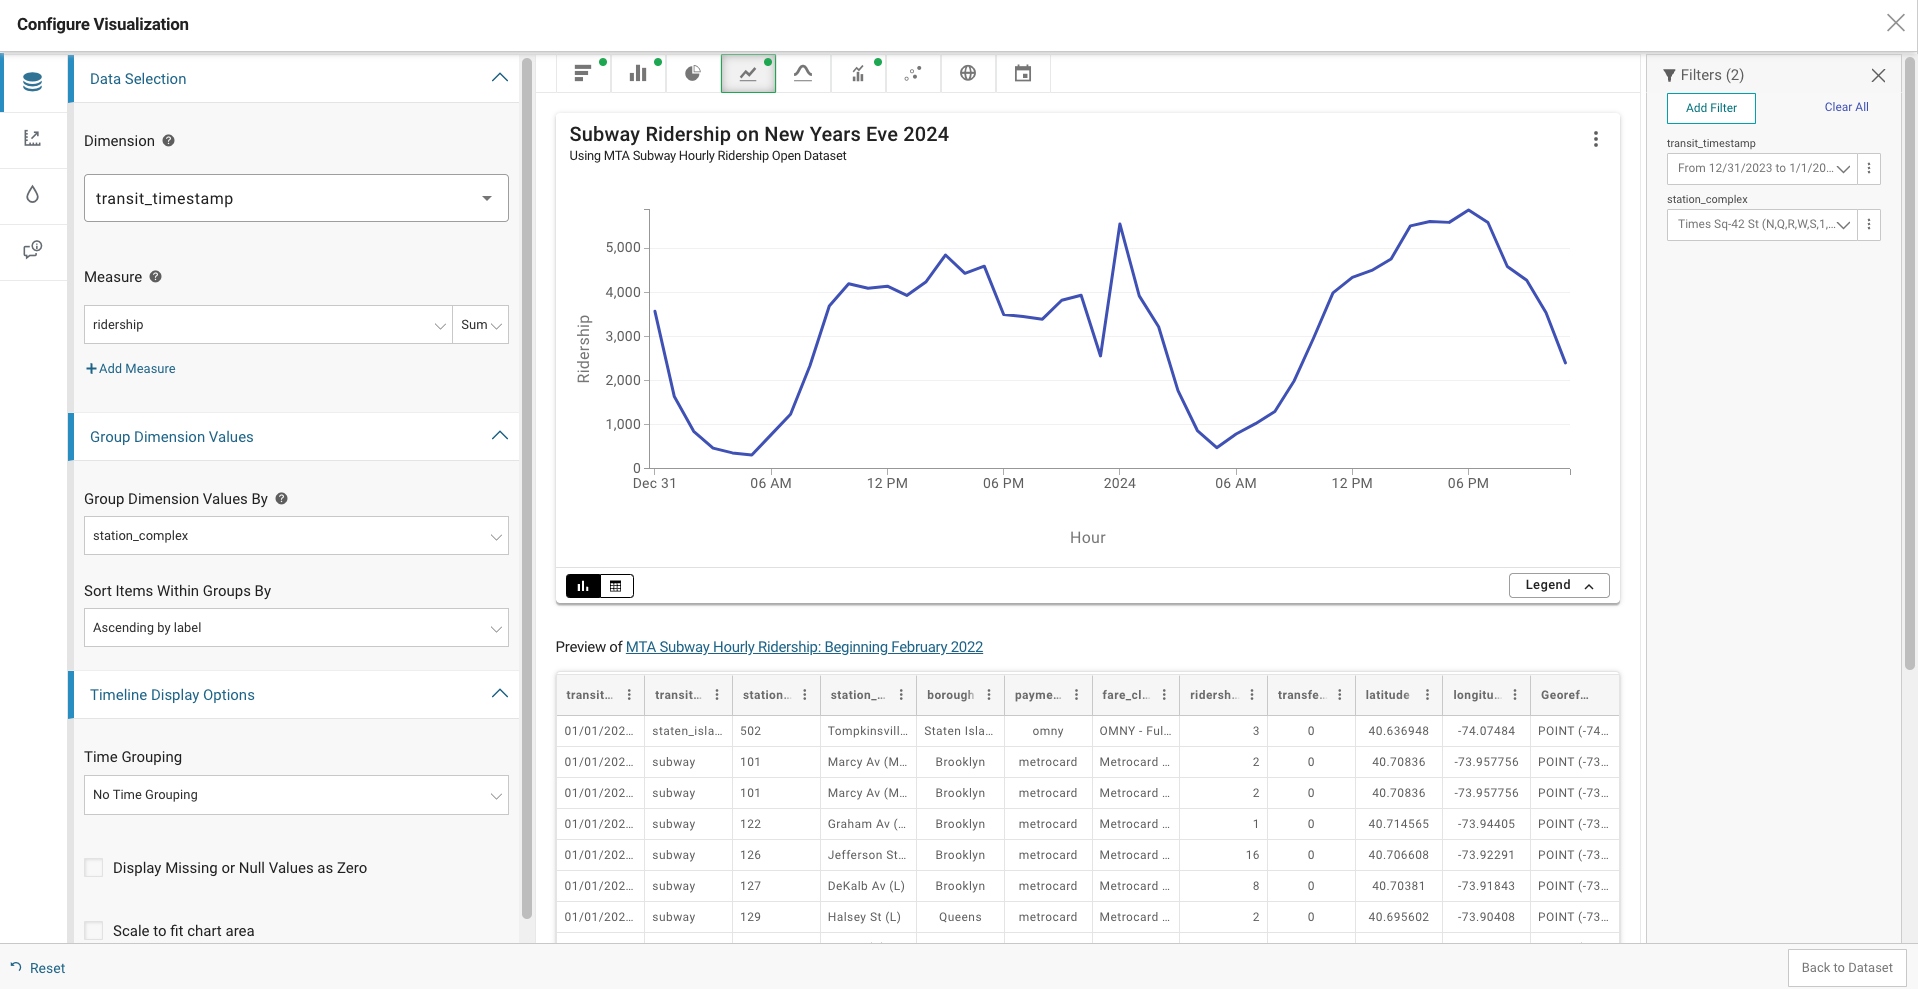
Accessing the data: Option 3: Visualizing the data
Lastly, the Open Data platform features an integrated tool for data visualization. From the Subway Hourly Ridership home page, select the ‘Actions’ button, followed by ‘Visualize’ and then ‘Create visualization.’
In our example below, we chose to visualize the data to identity peak ridership using a timeline chart. Our Dimension (X-Axis) category is the transit_timestamp and Measure (Y-Axis) is the numerical value of ridership. Similar to our query above, we applied filters on transit_timestamp and station_complex. This tool also allows you to add configurations for the presentation of your chart on the lefthand pane.
Querying the data: Building simple filters and queries using API endpoint
The next stops on our journey involve the automation of data analysis methods listed above using a Python notebook and an Application Programming Interface (API). APIs are instrumental to capture rapidly changing datasets, efficiently query the data, and build custom analysis. To use an API, you first need to make a request to a remote web server to retrieve the data.
What is SODA?
SODA stands for “Socrata Open Data API.” It's a set of APIs provided by Socrata to a multitude of open datasets hosted by governments, NGOs, and other organizations. SODA serves as a key junction in the Data Express and offers a direct route to a vast repository of information.
How to find your API endpoint
From the Home page, select ‘Export’ followed by the ‘API’ button, and you’ll find the API endpoint under ‘API Endpoint.’
Making SODA API requests with Python
Before this stop, you need to install the python package ‘requests’ using your method of choice (most notably pip). Here’s how you can fetch the data using Python's requests library, and then read the data into a Pandas dataframe:
# Read in Subway data from API

import requests

import pandas as pd

url = "https://data.ny.gov/resource/wujg-7c2s.json?$where=transit_timestamp >= '2023-12-31T00:00:00'"

response = requests.get(url)

data = response.json()

# Read in Pandas dataframe

df_sub = pd.DataFrame.from_dict(data)

df_sub.head()
Note: If you are on a corporate network, you might need to define and use proxies in the query to access the API, which your IT department should be able to provide. To use proxies, simply change above code to:
# Read in Subway data from API

import requests

import pandas as pd

url = "https://data.ny.gov/resource/wujg-7c2s.json?$where=transit_timestamp >= '2023-12-31T00:00:00'" >= '2023-12-31T00:00:00'"

proxies = {

"http": "insert your proxy",

"https": "insert your proxy"}
response = requests.get(url, proxies=proxies)

data = response.json()

# Read in Pandas dataframe

df_sub = pd.DataFrame.from_dict(data)
df_sub.head()
This example fetches Subway Hourly Ridership data and filters for data on or after midnight on December 31, 2023. The data is returned in JSON format, although you could specify other formats like CSV if you prefer.
Building simple filters and queries
SoQL statements are broken into “parameters” similar to clauses in SQL statements. Each clause can be expressed either directly as a URL parameter or as a SoQL statement. The default is used if a parameter is not specified.
Paging and throttling
- Paging: Sometimes Socrata API requests will return a large number of results. Rather than retrieve them all at once, which may affect your application’s performance, you can use paging to retrieve the results in batches. Paging is accomplished through two query parameters:
$limitand$offset. - Throttling: Throttling is a technique that limits the execution of a function in a specified time interval. Free-tier API users have a shared pool of requests. For more requests, register for an application token for up to 1000 requests per rolling hour period.
SoQL allows us to query the database in a SQL-like syntax, which means we can perform various operations like filtering $where, sorting $order, and aggregation $group directly at the API level. Make sure to add ‘&’ after every statement.
Your individual statements may look like this:
#Each of these are SoQL statements starting with `$`

$where=transit_timestamp >= '2023-12-31T00:00:00' AND transit_timestamp <= '2024-01-01T00:00:00' AND borough = 'Manhattan' AND station_complex = 'Times Sq-42 St (N,Q,R,W,S,1,2,3,7)/42 St (A,C,E)'

$order=transit_timestamp ASC

$group=station_complex, transit_timestamp

$select=station_complex, transit_timestamp, sum(ridership) as total_ridership
Altogether, your final query will look like this:
https://data.ny.gov/resource/wujg-7c2s.geojson?$limit=1000000&$where=transit_timestamp >= '2023-12-31T00:00:00' AND transit_timestamp <= '2024-01-01T00:00:00' AND borough = 'Manhattan' AND station_complex='Times Sq-42 St (N,Q,R,W,S,1,2,3,7)/42 St (A,C,E)'&$order=transit_timestamp ASC&$group=station_complex, transit_timestamp&$select=station_complex, transit_timestamp, sum(ridership) as total_ridership
This query accesses the API URL to filter the dataset to include only 2023 New Year’s Eve. To achieve this sort by timestamp, borough and station name, group by station name and timestamp, and aggregate the sum of ridership.
Conclusion
Open data platforms with powerful querying capabilities like Socrata allow us to cruise through complex datasets with ease. We think the MTA’s Subway Hourly Ridership dataset is the perfect case: it provides a wealth of information for a range of applications, from trend analysis to operational optimization to public policy formulation.
This is the last stop on our journey today, but we encourage you to stay involved: read our other blog posts, test the data and give us feedback at opendata@mtahq.org!
For a more in-depth tutorial on what’s covered here, join our NYC Open Data Week virtual workshop on using SoQL to explore MTA open data. Read more details and register here.
About the authors
Niki Keramat and Rahnuma Tarannum are data scientists on the Data & Analytics team, focusing on open data.